Graylog2 - 3 - Logstash nagios_nsca
Introduction
Here we will explain howto add notifications to nagios using Graylog and logstash.
In this case we will send 2 notifications:
- from Graylog using Streams and commands plugin.
- From Logstash using plugins-outpus-nagios-nsca

Requirements
Have read both articles:
We need also 2 new roles to have in our ansible-control-machine.
We will use requirements.yml, and follow same steps: Graylog_ansible_installing_roles
So add these lines:
- src: https://github.com/CoffeeITWorks/ansible_nagios_graylog2_nsca.git
  name: ansible_nagios_graylog2_nsca

- src: https://github.com/CoffeeITWorks/ansible_nagios_graylog2_nsca_config_nagios.git
  name: ansible_nagios_graylog2_nsca_config_nagios
And install the roles with ansible-galaxy install -r requirements.yml
Ansible Inventory
We will use same inventory as created at: at Graylog_ansible_inventory
Preparing the variables
The folder was created during the preparatives at: Graylog_ansible_variables
We will modify group_vars/graylog2_servers/logstash_vars:
Modify logstash_custom_outputs variable, so it will look like:
logstash_custom_outputs:

  - output: 'gelf'
    lines:
      - 'host => "localhost"'
      - 'port => "12201"'

  # https://www.elastic.co/guide/en/logstash/current/plugins-outputs-nagios_nsca.html
  - output: 'nagios_nsca'
    if_condition: '"Resolved" in [status]'
    lines:
      - 'host => "{{ ansible_nagios_graylog_nagios_server }}"'
      - 'nagios_service => "LOGSTASH"'
      - 'nagios_status => "0"'
      - 'nagios_host => "{{ ansible_nagios_graylog_hostname }}"'

  - output: 'nagios_nsca'
    if_condition: '"Activated" in [status]'
    lines:
      - 'host => "{{ ansible_nagios_graylog_nagios_server }}"'  # This is the nagios server
      - 'nagios_service => "LOGSTASH"'                        # This is the service to send status in nagios.
      - 'nagios_status => "2"'                                # The status to send to the service.
      - 'nagios_host => "{{ ansible_nagios_graylog_hostname }}"'  # This is the host to send status in nagios.
As noticed we added 2 output nagios_nsca, with conditions (One for Activated and other for Resolved in [status]). As we have
filtered (transformed) the data to json, we can us the if condition. See Graylog_logstash_input.
In this example the json data has [status] var to check, but you can also use without if condition to send nsca check always.
We have also ansible_nagios_graylog_main_server and ansible_nagios_graylog_host vars, you can define here the host and nagios_host.
We will define also file with these two vars:
group_vars/graylog2_servers/nagios_graylog:
If you have different servers for testing and production you could put these variables on the specific host_vars/grayloghostname
---

ansible_nagios_graylog_nagios_server: 'YOURNAGIOSSERVER'

# This variable will be used by ansible_nagios_graylog2_nsca role.
# Will create an script called  /usr/local/sbin/graylog2-alert.sh
# This script is by default defined in var ansible_nagios_graylog_nsca_script, but you don't need to change it.
# It's a list of nagios hosts to send the command nsca
ansible_nagios_graylog_nagios_servers:
  - '{{ ansible_nagios_graylog_nagios_server }}'

# The hostname that will be created in nagios to
# setup nagios_services and then receive the alerts on these nagios_services
ansible_nagios_graylog_hostname: 'YOURGRAYLOGHOSTNAME'
Preparing variables for nagios_config
We will need to setup inventory with nagios4_servers group and add our nagios host here.
Then add file: group_vars/nagios4_servers/nagios_graylog
If you have different servers for testing and production you could put some of these variables on the specific host_vars/nagioshostname
ansible_nagios_graylog_setup_nagios_host: true
ansible_nagios_graylog_hostname: 'YOURGRAYLOGHOSTNAME'  # Your grayloghostname to setup the nagios service
ansible_nagios_graylog_parents: 'FRB_CLUSTER'
ansible_nagios_graylog_address: 'IP.ADD.RE.SS'  # Your graylog ip add to setup the nagios host
ansible_nagios_graylog_template: 'servers_linux_template'  # Change it to your own template or use generic-service

# nagios configuration (optional settings):
ansible_nagios_graylog_setup_nagios_service: true

# Nagios Service for each streams to configure:
ansible_nagios_graylog_nagios_streams:

  - name: "Graylog2-Azure_streams"
    contact_group: "Graylog2-Azure_streams"

  - name: "LOGSTASH"
    contact_group: "Graylog2-Azure_streams"

# Nagios contact groups for each streams:
ansible_nagios_graylog_nagios_streams_contactgroups:

  - contact_group: "Graylog2-Azure_streams"
    members: "nagiosadmin"

# nagios configuration options:
nagios_etc: '/usr/local/nagios/etc'
# Where we will add the nagios configuration
nagios_config_cfg_dir: "{{ nagios_etc }}/conf.d"
Preparing the playbook to run the roles
Here we will add to roles.graylog2.yml as examplained at: Graylog_ansible_playbook
- name: Apply nagios_nsca for graylog2 servers
  hosts: graylog2_servers
  become: yes
  # environment: "{{ proxy_env }}"
  roles:

    - role: ansible_nagios_graylog2_nsca
      tags:
        - role::ansible_nagios_graylog2_nsca
        - graylog2_servers


- name: Config nagios hosts service and host for graylog nsca stream services
  hosts: nagios4_servers
  become: yes
  # environment: "{{ proxy_env }}"
  roles:

    - role: ansible_nagios_graylog2_nsca_config_nagios
      tags:
        - role::ansible_nagios_graylog2_nsca
        - role::ansible_nagios_graylog2_nsca_config_nagios
Run the playbook
use same steps as described in: Graylog_ansible_run
Or run only logstash role calling with tag:
ansible-playbook -i inventory roles.graylog2.yml --limit graylog2_servers -u user -k -K --become --tags
What we have done
- We have modified logstash vars, now we have two outputs sending nsca message to nagios service.
- We have added role: ansible_nagios_graylog2_nsca_config_nagios. ** It will create our configuration in nagios.
- We have added role: **ansible_nagios_graylog2_nsca ** It will add script: /usr/local/sbin/graylog2-alert.sh ** Also will setup configure graylog2-plugin-exec
You can use your own nagios config to setup the host and server, then not need to use ansible_nagios_graylog2_nsca_config_nagios role if you don’t like it. But using this role will make things faster.
Configure graylog for exec
Now logstash is sending alerts, but we need to setup Graylog Alerts to use Exec callback plugin
Checkout doc: https://github.com/nksft/graylog2-plugin-exec#usage
First create a Stream
I will create 2 streams for Azure messages:
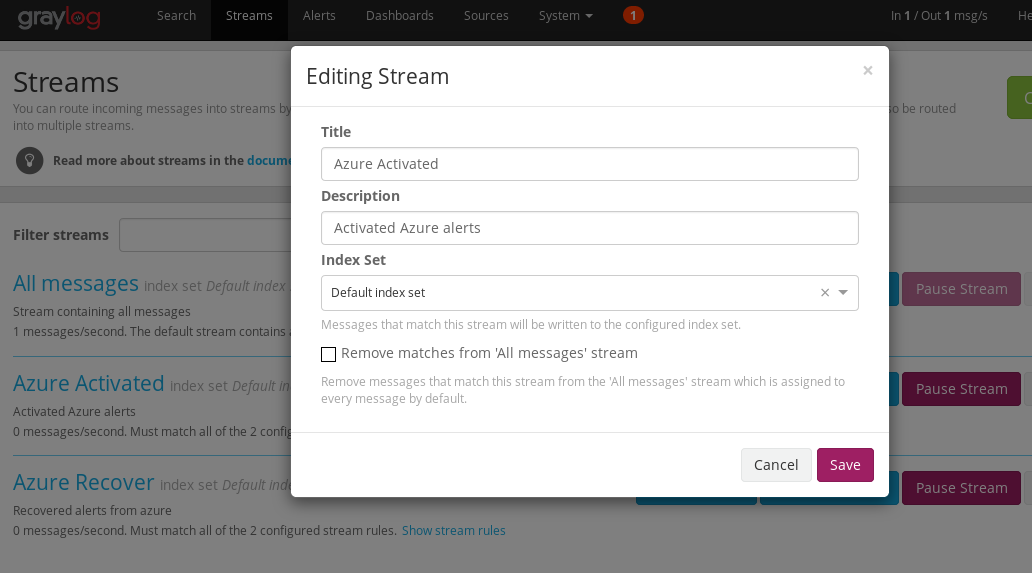
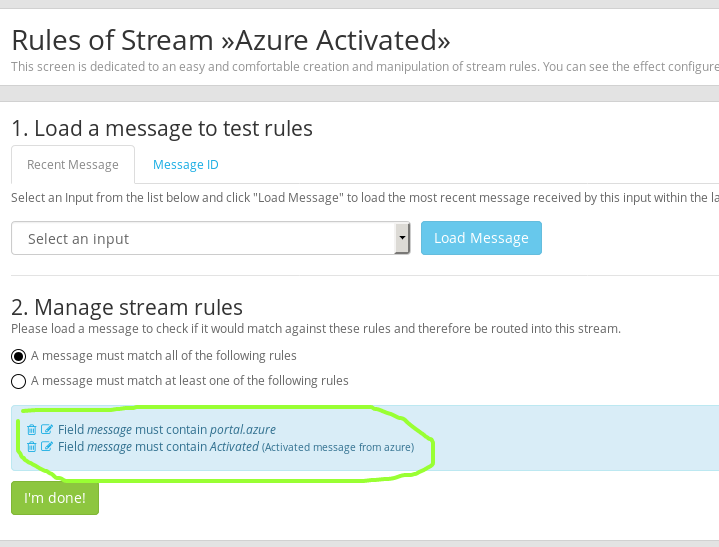
And add rule for it:
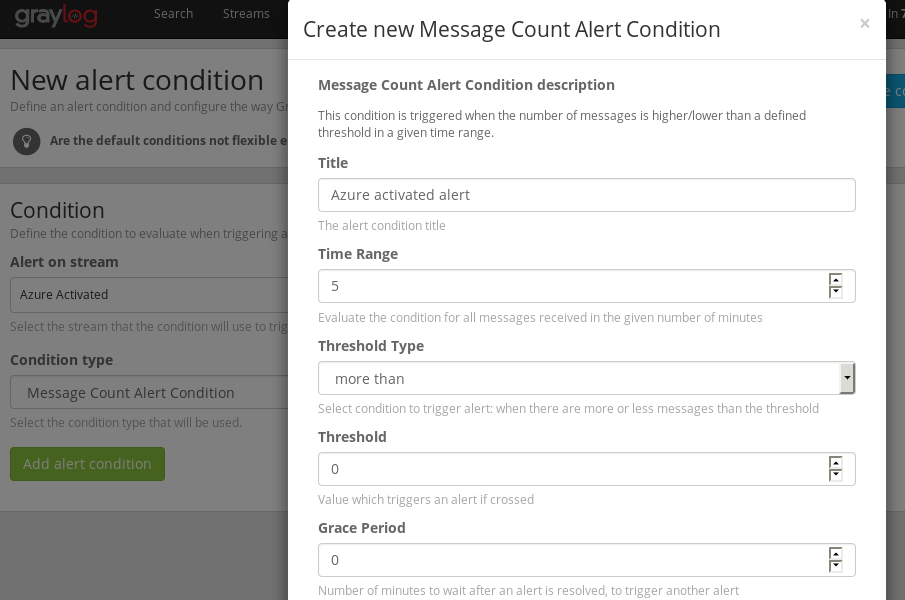
Now we will create **Graylog_alert For our stream
create new alert condition like:
Then add Notifications as Exec callback plugins
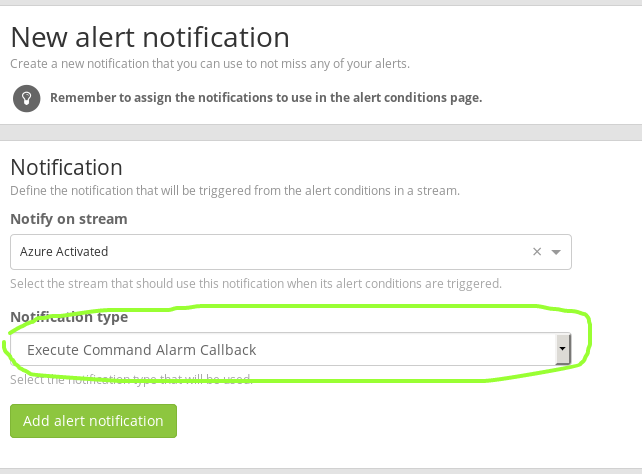
Add to your notification command:
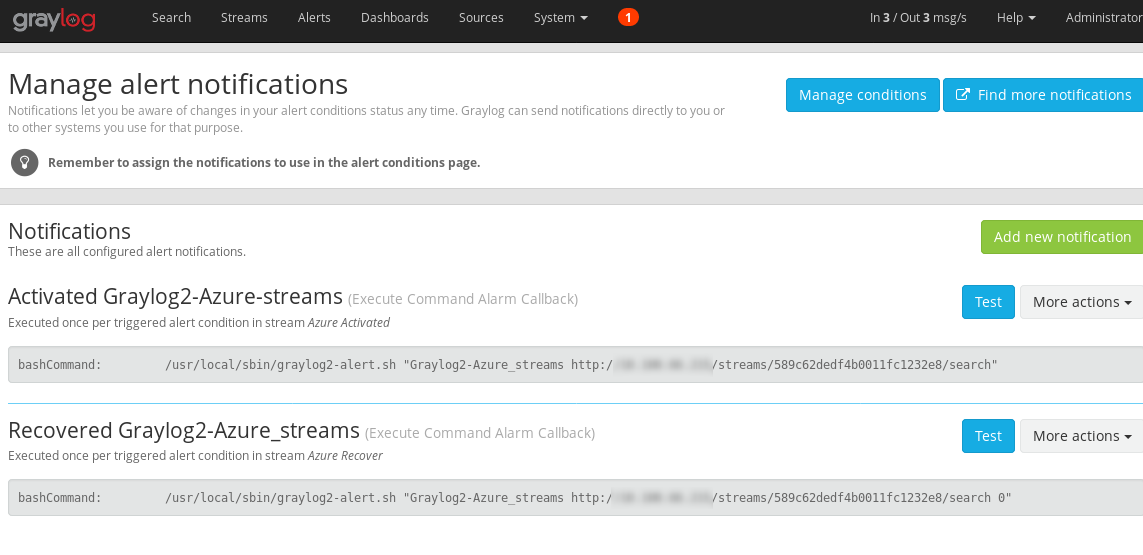
- Title:
Activated Graylog2-Azure-streams - Command:
/usr/local/sbin/graylog2-alert.sh "Graylog2-Azure_streams http://YOURGRAYLOGIP/streams/589c62dedf4b0011fc1232e8/search"
Where Graylog2-Azure_streams is the service name on nagios. And second parameter is a message to put in the check
589c62dedf4b0011fc1232e8 is the id for your stream.
You will then have and will be able to test directly from graylog:
That’s it.
Now you can add many streams and more nagios services for each of your streams with your own settings.
These examples are done with Azure alerts, but they apply to any other kind of alert.